Getting Started with Cloudmersive Analytics - API Analytics and Threat Detection Analytics
You can monitor API usage for each of your API keys using API Analytics. You can monitor threats detected, including viruses and malware, using Threat Detection Analytics.
Step 0 - Enabling Analytics
If you are using Cloudmersive Managed Instance or Public Cloud, then de-identified analytics are enabled by default for qualifying plans. If you are using Cloudmersive Private Cloud or Cloudmersive Reverse Proxy Server, analytics will need to be enabled. For Private Cloud, navigate to the Cloudmersive Management Portal, click on Private Cloud, then select the relevant node, then click on Configure Node, Advanced Settings, and then enable Basic Diagnostic Data Collection and Full Diagnostic Data Collection, then click Save. For Reverse Proxy Server, navigate to the Cloudmersive Management Portal, click on Private Cloud, click on Sites, select Manage next to the site in question and add a Cloudmersive Log Analytics logging policy to the site and then click on Push Configuration.
Cloudmersive Private Cloud and Managed Instance can also send Analytics to Splunk, AWS CloudWatch Logs, Azure Log Analytics, and a number of other logging platforms.
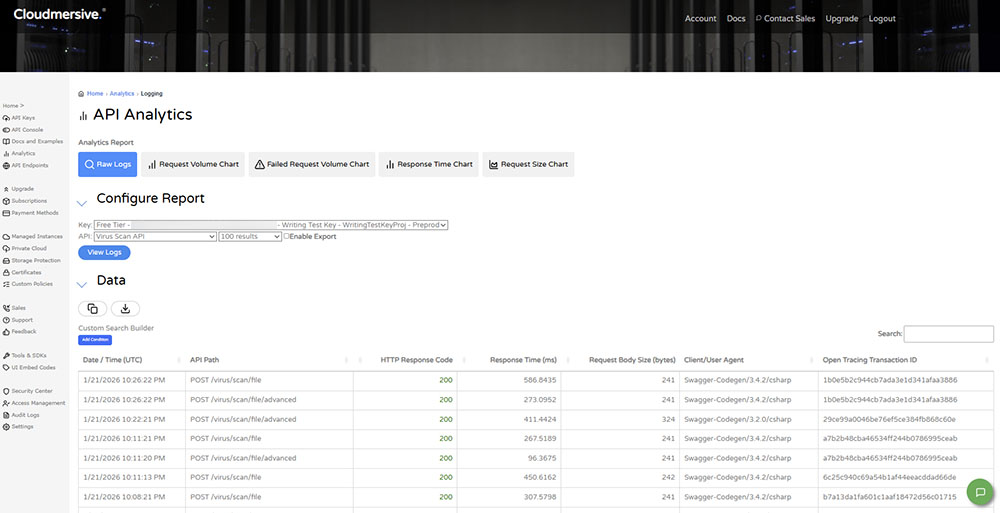
Step 1 - View API Analytics Logs
To view API Analytics logs, you must have a plan or product that includes this feature. To access the logs, navigate to the Cloudmersive Management Portal and click on Analytics and then API Analytics. From here you can select the API key, API type (i.e. Document and Conversion API, OCR API, etc.), and maximum number of results from the drop-down options. Once these are set, you can click View Logs to view the timestamp, API Path, HTTP Response Code, Response Time, and Client/User Agent.
Step 2 (Optional) - Export and Download Results
You can also optionally export and download your log results. To initiate the export action, check the Enable Export box prior to clicking View Logs in the previous step. Now, once you click View Logs, a Download Excel link with an arrow next to it will be generated below the Data heading. To download your results, click on the link and open the newly generated Excel file.
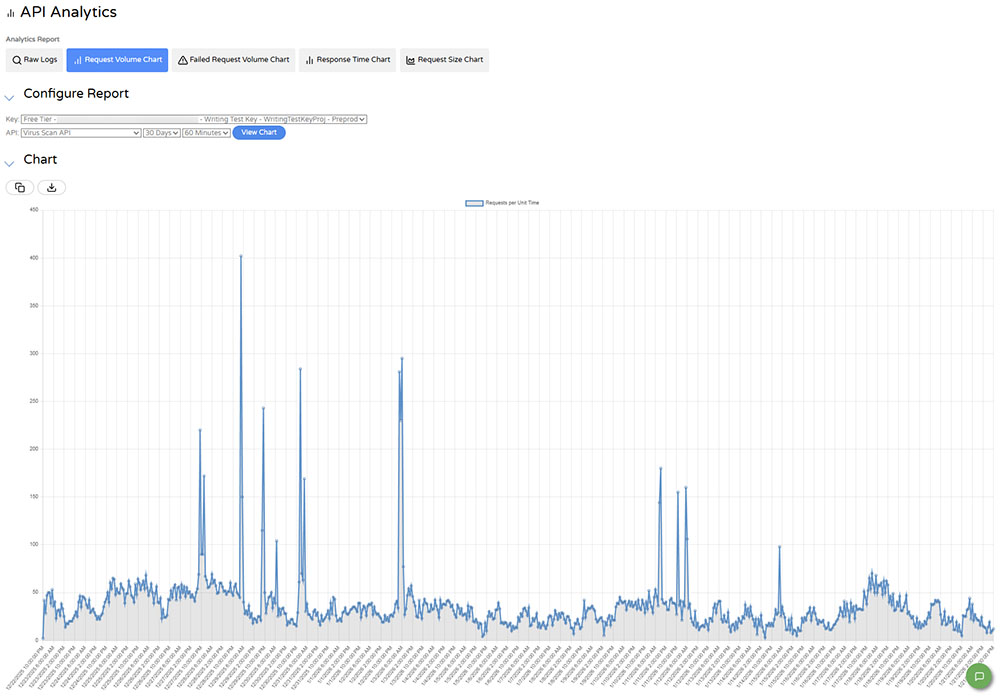
Step 3 - View API Analytics Charts
To access the charts, navigate to the Cloudmersive Management Portal and click on API Analytics. Now click on Request Volume Chart, Failed Request Chart, Response Time Chart, or Request Size Chart. You can customize time range and ganularity, and where appropriate aggregation function (e.g. average, percentile).
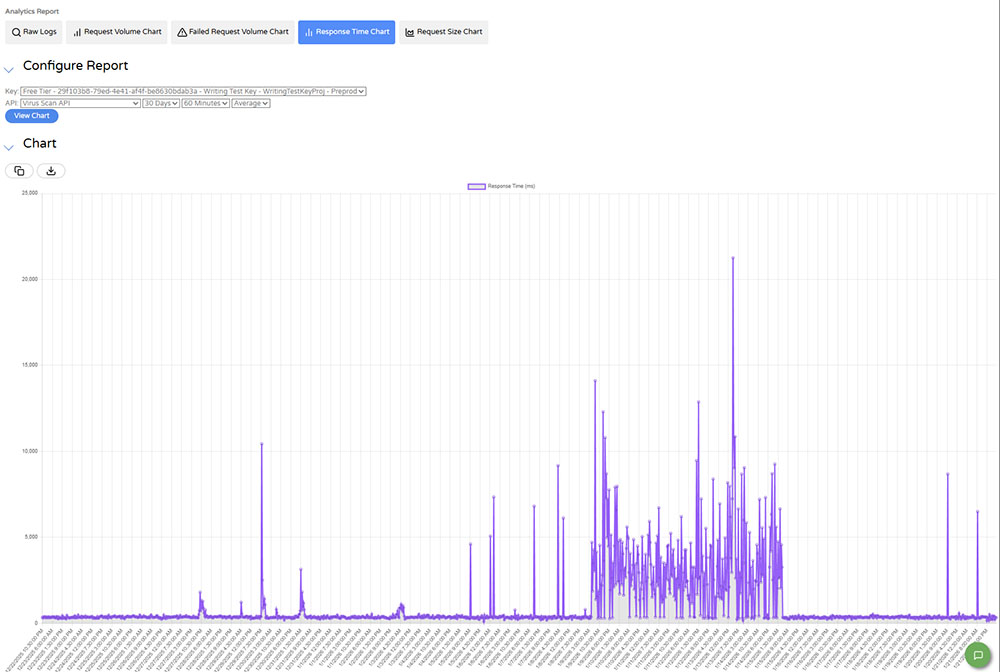
Here, we now select Response Time Chart:
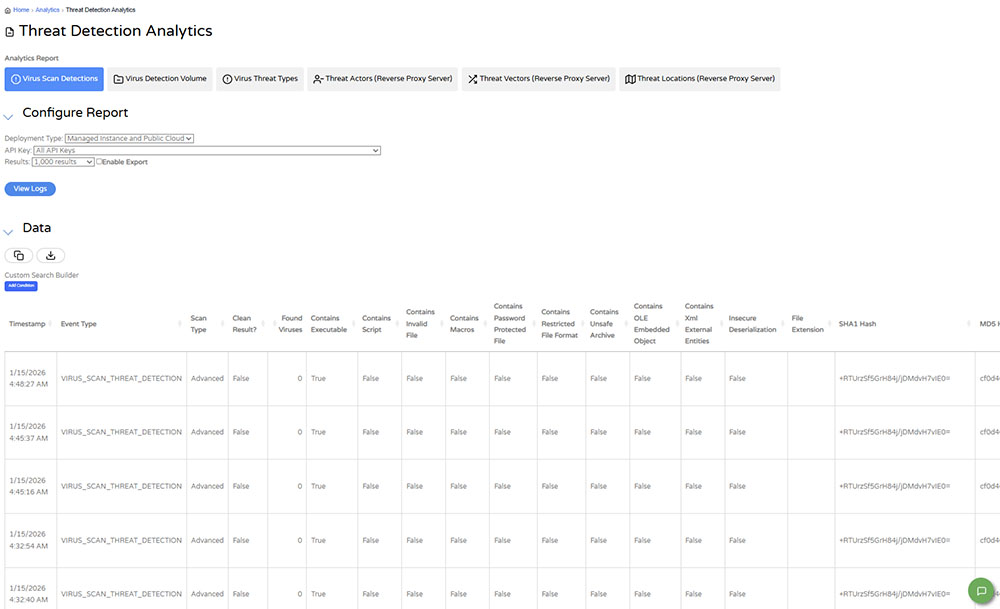
Step 4 - View Threat Detection Analytics Logs
To view threats detected, such as viruses and malware, use Threat Detection Analytics. To view threat detection analytics you must have a plan or product that includes this feature. To access the logs, navigate to the Cloudmersive Management Portal and click on Analytics and then Threat Detection Analytics.
Here we can view and filter individual threats that were detected:
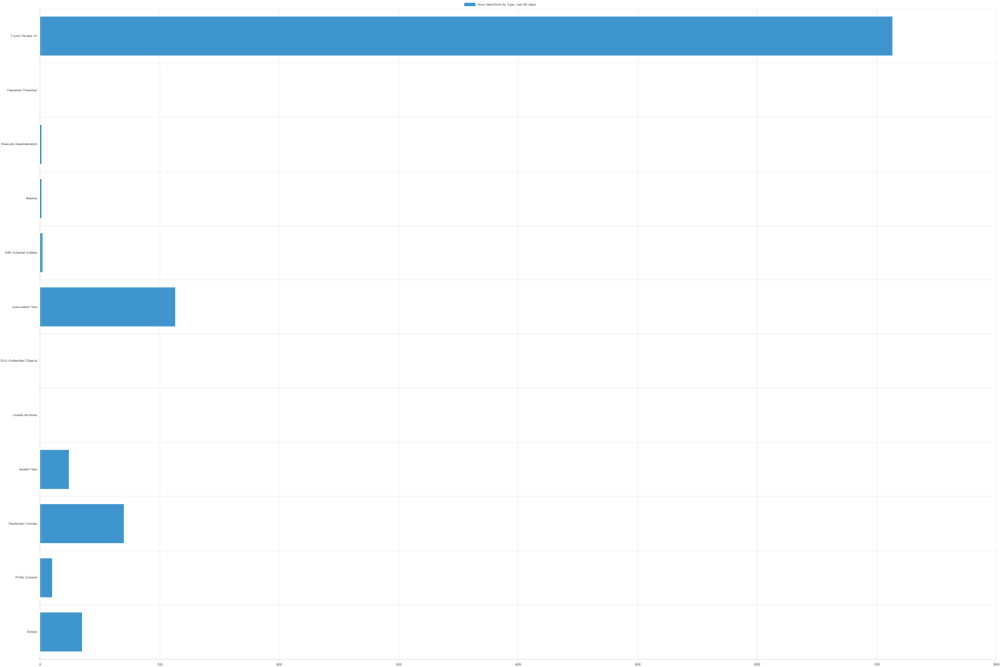
Step 5 - View Threat Detection Analytics Charts
We can view charts for Virus Detection Volume, Virus Threat Types, Threat Actors (when using Cloudmersive Reverse Proxy Server), Threat Vectors (when using Cloudmersive Reverse Proxy Server), and Threat Locations (when using Cloudmersive Reverse Proxy Server). Click on Virus Threat Types to see a chart of a breakdown of threat types: